
Why We Can’t Trust GreenSquareAccord’s KPI Figures
And What This Means for Their Latest Strategy
GreenSquareAccord has just released another shiny three-year customer strategy, this time rebranded as a bold 2025–2028 vision. But before anyone buys into the glossy narrative, let’s pause and ask: what have the last two years actually delivered for residents?
If we go by their own Key Performance Indicators (KPIs), the answer is mixed. On paper, there are improvements — but scratch the surface and a much more troubling picture starts to emerge.

According to an official GSA document, the cleaner is tasked with tidying up and reporting issues. But through no fault of his own — he doesn’t speak a word of English — it’s clear he isn’t reporting faults. He certainly didn’t report the absence of lighting on the top floor, which had been out for at least two weeks, according to some residents. Meanwhile, other GSA contractors were on site inspecting the roof and — presumably — other issues. Yet nothing was raised.
When I called the 24-hour out-of-hours line to report the lighting, I was told someone might come — and if not, to call back. No one came that night. So how was that call recorded? Was it even logged?
The next day, I called again, and this time someone did attend but was unable to gain access, so they left a card. It stated that if they didn’t hear back in three days, they’d assume the job was resolved and would close it. So, is that showing as a repair completed within 24 hours? Is it logged as a successful first-time fix?
By day three, I called again. Still no resolution. By this time I had uploaded videos across YouTube, LinkedIn, X, and Facebook — and alerted the local fire brigade and Oxfordshire County Council — that action was finally taken. The videos had a major impact, with over 2,000 views on YouTube alone — not counting other platforms.
Then came the email from our home ownership officer, David Luscombe, certified by the Chartered Institute of Housing. His message read:
"I understand the Oxfordshire Fire Service attended Mooring Christian House over the weekend... [abridged]... The electrician stayed on site for half an hour to monitor and found no further issues. If you have any questions, please let me know."
What’s missing? Any form of accountability. Any acknowledgment of the multiple earlier reports. The only record they seem to have is the one made by the Fire Service.
If that's how they’re tracking incidents, how can any of the stats be trusted?
The Illusion of Progress
GreenSquareAccord has made a big song and dance about the many millions it claims it will be investing in our homes over the next year. But this isn’t a success story — it’s a symptom. The housing stock has become so dilapidated that repairs are skyrocketing. When homes aren’t being sold off, the cost of maintaining them rises sharply. Their own figures back this up.
I’ve compared Q1 of 2022 with Q1 of 2025. This isn’t just a helpful look back — it’s essential context for their new three-year plan. And I, like many others, don’t hold much faith in it.
Take the recent emergency lighting issue. It’s a perfect example of why these stats can’t be taken at face value — and why trust between residents and GreenSquareAccord is so fractured.


So Let’s Look at the Stats
I’ve compared January, February, and March of 2023 and 2025 side by side using GreenSquareAccord’s own KPI reports. The figures show a mix of modest improvements, persistent failings, and worrying new trends.
But the numbers alone aren’t the problem — it’s what they don’t show that’s even more revealing
January 2023 - January 2025


What This Tells Us
Repairs: Yes, on paper things look better — more are completed, more are done on time, and more are fixed first time.
Complaints: But complaints have more than tripled, and the percentage of those being not upheld has doubled, while incomplete action has surged.
Call handling: Wait time may be shorter, but fewer calls are answered quickly — suggesting a drop in efficiency despite improvements in call tech or staffing.
Satisfaction Scores: The real-world test — resident satisfaction with complaints was 38% in Jan 2023, now marked as 83%. That’s either a miracle turnaround — or a stat worth auditing.
February 2023 - February 2025


What This Tells Us
Repairs: GSA is completing more repairs faster — but demand has nearly doubled, which may be putting strain on quality.
Complaints: They’ve exploded. A tenfold increase in just two years. While “incomplete actions” have improved, more complaints now cite delays and service failure.
Call handling: Fewer calls are answered within two minutes. The average wait remains above four minutes — not good enough.
Comms issues: GSA claims a massive drop in communication-related complaints — but with service failure now the top issue, this may simply be a reclassification of problems.
March 2023 - March 2025
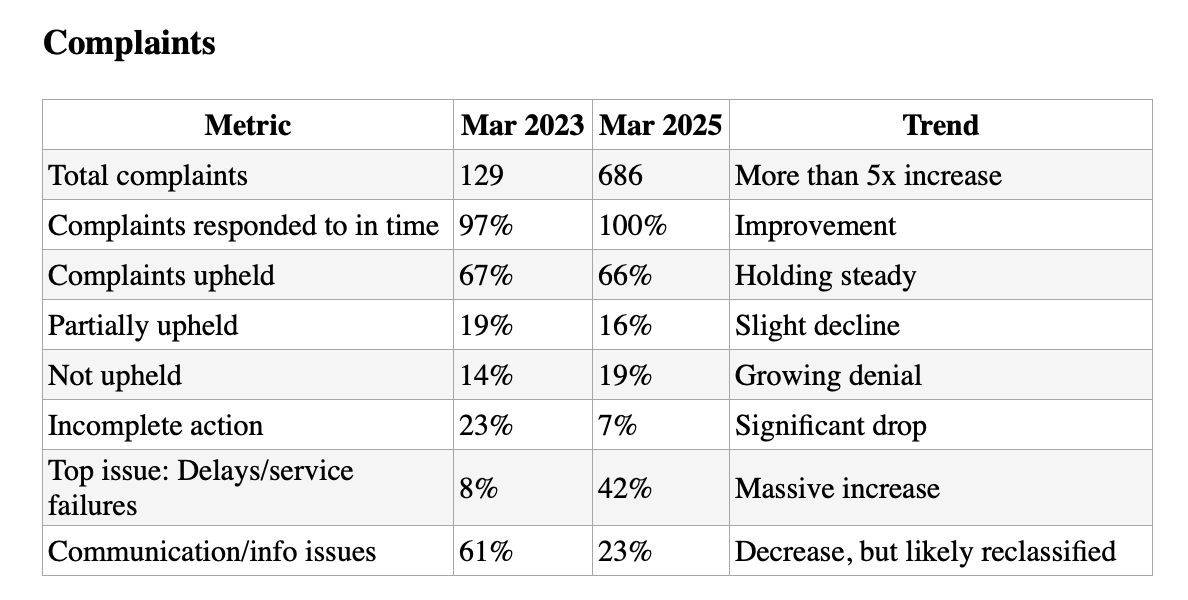
What This Tells Us
Repairs have improved sharply — especially routine turnaround times and completion volumes.
Complaints are up over 5x, and while upheld rates remain steady, delays/service failure has surged from 8% to 42% — a red flag that things may look fixed in KPIs but feel broken to residents.
Call handling: 2m 56s wait time is their best in months, but email response times have worsened.
Q1 2023 - Q1 2025
Customer Contact & Communication
Emails Received
▸ Q1 2023: 7,260
▸ Q1 2025: 6,815
⟶ Fewer emails might suggest reduced demand — or residents giving up.Average Email Response Time
▸ Q1 2023: 3 days
▸ Q1 2025: 5 days
⟶ A significant decline in response speed.Calls Received
▸ Q1 2023: 19,791
▸ Q1 2025: 17,413
⟶ Calls have dropped, but is that because issues are being resolved — or because people are losing faith in the system?Average Call Waiting Time
▸ Q1 2023: 4 mins 6 secs
▸ Q1 2025: 2 mins 56 secs
⟶ A real improvement here — but without abandoned call data, we can’t be sure how many gave up trying.Calls Answered Within 2 Minutes
▸ Q1 2023: 54%
▸ Q1 2025: 54%
⟶ No progress in two years.
Repairs & Maintenance
Routine Repairs Completed On Time
▸ Q1 2023: 45%
▸ Q1 2025: 88%
⟶ A huge jump — if accurate, this would be positive, but trust in the data remains a concern.Fixed First Time
▸ Q1 2023: 80%
▸ Q1 2025: 87%
⟶ A modest but steady improvement.Emergency Repairs Completed Within 24h
▸ Q1 2023: 98%
▸ Q1 2025: 99%
⟶ Slight increase — but individual experiences (like the emergency lighting issue) tell a different story.Total Repairs Completed
▸ Q1 2023: 4,736
▸ Q1 2025: 8,045
⟶ A dramatic increase — either more problems, or more capacity to respond. Or both.Repairs Reported
▸ Q1 2023: 5,474
▸ Q1 2025: 7,426
⟶ Again, an increase in reported issues suggests stock quality is deteriorating, not improving.
Complaints
Stage 1 Complaints Responded to On Time
▸ Q1 2023: 97%
▸ Q1 2025: 91%
⟶ A backwards step in responsiveness.Stage 2 Complaints Responded to On Time
▸ Q1 2023: Not listed
▸ Q1 2025: 100%
⟶ Potentially good news — but we can’t compare with previous data.Upheld Complaints
▸ Q1 2023: 67%
▸ Q1 2025: 66%
⟶ Little change. Two years, same trend.Partially Upheld Complaints
▸ Q1 2023: 19%
▸ Q1 2025: 16%
⟶ Slight decrease.Not Upheld Complaints
▸ Q1 2023: 14%
▸ Q1 2025: 19%
⟶ More complaints being dismissed.Top Complaint Type: Delays/Failures
▸ Q1 2023: 8%
▸ Q1 2025: 42%
⟶ A five-fold increase. This is serious.
Customer Satisfaction
Call Centre Satisfaction
▸ Q1 2023: 44%
▸ Q1 2025: 55%
⟶ An 11-point rise, but still low.Repairs Satisfaction
▸ Q1 2023: 88%
▸ Q1 2025: 90%
⟶ A slight improvement — but again, the gap between stats and stories remains wide.
The Missing Metrics
One of the most glaring issues in GSA’s reporting isn’t what’s included — it’s what’s omitted. I’ve manually saved each monthly KPI report because GSA doesn’t make these publicly available beyond a few months. That’s not transparency — that’s avoidance. Without historical access, there’s no way for the public to track real progress over time.
But even more troubling is the absence of one essential metric: abandoned call rates.
Every call centre tracks this figure. It shows how many callers gave up waiting and hung up. It’s a standard feature of every call handling system — and GSA will absolutely have this data. Yet they choose not to share it.
Without abandoned call data, average wait times are meaningless. They only represent those who got through — not those who gave up.
Why Abandoned Calls Matter
For anyone who thinks this isn’t a big deal, I encourage you to listen to the recording of my own experience: nearly five full minutes on hold to report an emergency lighting fault. That’s already over their reported average wait time.
Ask yourself: would you have stayed on the line? Or would you have hung up and hoped someone else might report the issue?
Every abandoned call represents a risk that goes unreported, a repair that doesn’t get logged, and a person left without support — and yet these moments vanish from the official story. It’s a hidden failure.
And when failure gets hidden, it multiplies.
What Other Metrics Are GreenSquareAccord Choosing Not to Report?
Repeat Repairs / Follow-Up Visits
They report “repairs completed” — but how many of those were fixed on the first visit? If a job requires revisiting multiple times, that should count against them. I suspect GreenSquareAccord avoids this metric because it exposes systemic failure and poor workmanship.
Service Failure Compensation Paid
There’s no reporting on how often residents are awarded compensation under the Right to Repair, or due to upheld complaints. This figure would help quantify the cost of poor service — and highlight how frequently GreenSquareAccord fails to meet its own standards.
Missed Appointments
No data is shared on how often operatives fail to show up for booked appointments — despite this being one of the most common and stressful issues for residents. It’s a basic internal metric in most housing providers, yet GSA rarely publishes it.
Resident Call-Back Rates
If residents have to phone back multiple times to resolve a single issue, it indicates poor resolution rates and inadequate triaging. GreenSquareAccord tracks “calls answered” — but not whether those calls actually resolved the problem, or how many were repeat contacts. This could be because GreenSquareAccord lacks the systems to properly track call progression — something many residents can attest to. Or, more worryingly, it could be because they simply don’t want to share that data.
Costs Associated with Legal Action and Disrepair Claims
There’s no insight into how much is being spent on legal challenges, Ombudsman cases, or compensation tied to disrepair. Rising legal costs often signal worsening service — but GSA keeps this part of the story hidden.
Why This Matters
By reporting only the metrics that suit them — and by doing so without historical transparency — GreenSquareAccord presents a curated version of reality that obscures the scale of the problem.
As residents, campaigners, and sector professionals, we’re being sold the idea of improvement — but not given the data to test whether it’s actually happening.
How much faith can we really place in GreenSquareAccord’s latest customer strategy? We’re only at the start of this new three-year plan, but when you compare it with the last two years, it’s hard to feel optimistic.
They still can’t reliably track calls. Still close repairs prematurely. Still refuse to acknowledge when they’ve failed. Apologies are rare. Accountability is rarer.
The numbers tell a story — but it’s the culture that tells the truth. A culture that rushes to close jobs, spins poor outcomes, and avoids scrutiny. A culture that protects reputations rather than residents.
If this is the foundation for the next three years, we already know how the story ends.
We don’t need another glossy strategy. We need honesty. We need accountability. And we need leadership that’s brave enough to face failure — not bury it.